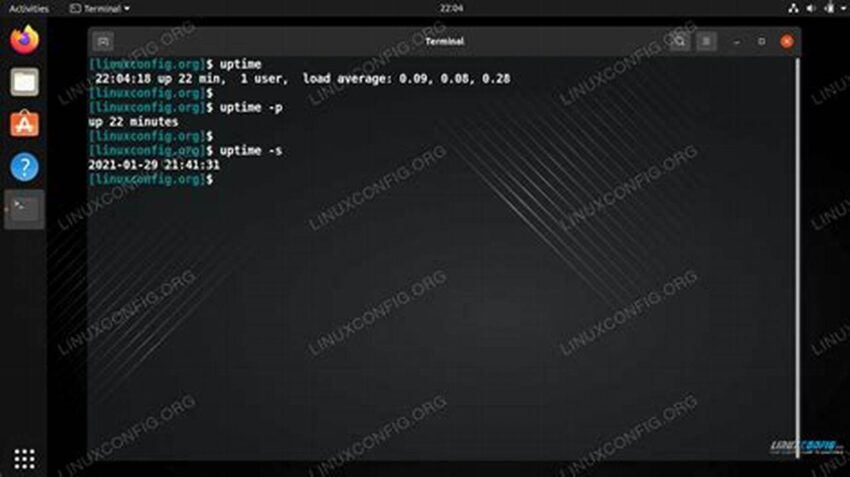
Understanding system uptime is crucial for system administrators. It provides valuable insights into system stability, maintenance schedules, and potential performance issues. A readily available tool in Linux distributions, the `uptime` command offers a simple yet effective method for retrieving this information. This guide explores the command’s functionality and its practical applications.
Displaying System Uptime
The primary function is to display the duration for which the system has been running since its last boot. This information is presented in a clear, concise format.
Current Time
The command also displays the current system time, providing context for the uptime duration.
Number of Users
The number of users currently logged into the system is another data point provided, offering a glimpse into system usage.
System Load Average
Crucially, the command presents the system load average over the past 1, 5, and 15 minutes. These figures offer valuable insight into system performance and resource utilization.
Quick System Health Check
The command serves as a quick system health check, allowing administrators to gauge system stability at a glance.
Troubleshooting Performance Issues
Examining the load average figures can help pinpoint potential performance bottlenecks and resource constraints.
Planning Maintenance
Uptime information is essential for planning maintenance windows and minimizing disruption to users.
Security Auditing
Unexpected reboots can indicate potential security breaches. Tracking uptime helps in security auditing and incident response.
Monitoring System Stability
Long uptimes can suggest a stable system configuration, while frequent reboots might point to underlying issues requiring investigation.
Tips for Using the Command Effectively
Combining with other commands
Piping the output to other commands like `awk` or `cut` can isolate specific information, such as the uptime duration or load average.
Using in scripts
Integrating the command into scripts allows for automated monitoring and alerting based on uptime or load average thresholds.
Remote execution
The command can be executed remotely via SSH, enabling administrators to monitor the uptime of multiple systems.
Interpreting load averages
Understanding how to interpret the load average figures is crucial for accurately assessing system performance. Generally, a load average exceeding the number of CPU cores indicates a system under strain.
Frequently Asked Questions
How do I access the command?
The command is accessible directly from the terminal in any Linux distribution.
What does a high load average indicate?
A high load average suggests that the system is struggling to keep up with the demands placed upon it, potentially leading to slowdowns or unresponsiveness.
Can the command be customized?
While the output format is standard, its output can be parsed and manipulated using other command-line tools for customized reporting.
Is the command resource-intensive?
The command is lightweight and has a negligible impact on system resources.
What if the command isn’t available?
While it’s standard, if missing, ensure the `procps` or equivalent package is installed using your distribution’s package manager.
How is uptime calculated?
Uptime is calculated from the moment the system finishes booting and becomes operational until the present moment. It doesn’t include time spent in hibernation or suspend modes.
The command provides a simple and effective means of monitoring system uptime and performance. Its ease of use and valuable output make it an essential tool for any Linux system administrator.

