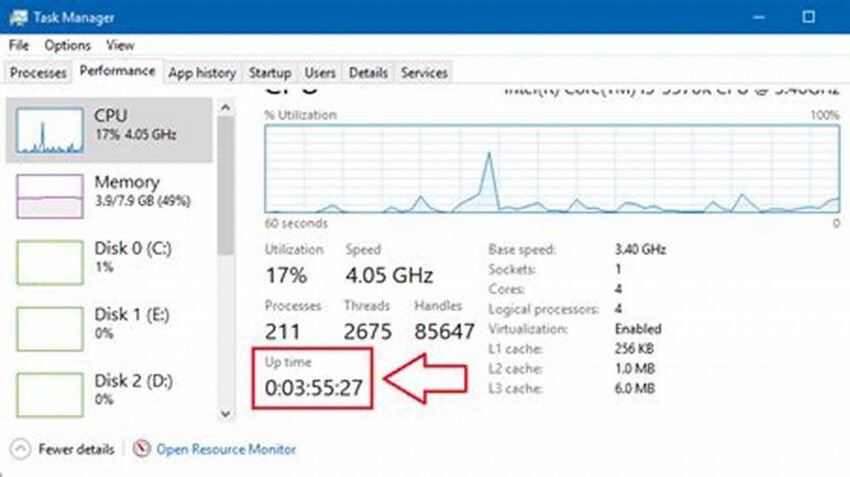
Maintaining optimal server performance is crucial for any online operation. Understanding how long a system has been running continuously, often referred to as system uptime, provides valuable insights into stability and reliability. For Linux servers, several methods exist to accurately determine this metric, enabling administrators to monitor performance, troubleshoot issues, and schedule maintenance effectively.
1. The `uptime` Command
This command provides a quick overview of the current system uptime, load average, and the number of users logged in.
2. The `w` Command
Similar to `uptime`, the `w` command displays system uptime, but also includes details about currently logged-in users and their activities.
3. The `/proc/uptime` File
This file contains two values: the total number of seconds the system has been up and the total number of seconds the system’s CPU has been idle.
4. The `systemd-analyze` Command (Systemd Systems)
For systems using systemd, this command provides a detailed breakdown of the boot process, including the total time taken.
5. The `last` Command
While not directly an uptime command, `last` shows recent logins and shutdowns, offering indirect insight into uptime by showing the gaps between sessions.
6. The `who` Command
This command lists currently logged-in users and their login times, which can be useful in conjunction with other commands to estimate uptime.
7. Monitoring Tools
Various monitoring tools, like Nagios, Zabbix, and Prometheus, can track server uptime and other performance metrics, providing alerts and historical data.
8. Logging Systems
System logs often record boot and shutdown events, providing another source of information for determining historical uptime.
9. Scripting for Automation
Custom scripts can be written to collect and analyze uptime data from various sources, enabling automated reporting and alerting.
10. Interpreting the Output
Understanding the output of these commands and files is essential for effective uptime monitoring. This involves interpreting time formats and load averages.
Tips for Effective Uptime Tracking
Tip 1: Regular Checks
Implement regular checks of server uptime to identify potential issues early on.
Tip 2: Trend Analysis
Analyze uptime trends to understand system stability and predict potential downtime.
Tip 3: Correlation with Other Metrics
Correlate uptime data with other performance metrics, such as CPU usage and memory consumption, for a comprehensive view of system health.
Tip 4: Automated Alerting
Configure automated alerts for unexpected downtime or significant drops in uptime to facilitate proactive intervention.
Frequently Asked Questions
How often should server uptime be checked?
The frequency of uptime checks depends on the criticality of the server and the specific monitoring needs. Regular checks, ranging from daily to hourly, are recommended.
What does high uptime signify?
High uptime generally indicates a stable and reliable system. However, it’s crucial to balance uptime with necessary maintenance and updates.
What can cause unexpected downtime?
Various factors can contribute to unexpected downtime, including hardware failures, software bugs, power outages, and network issues.
How can uptime data be used for capacity planning?
Historical uptime data can inform capacity planning by providing insights into system reliability and the frequency of required maintenance or restarts.
What are the limitations of using the `uptime` command alone?
While useful, the `uptime` command only provides a snapshot of current uptime. It doesn’t provide historical data or details about past downtime events.
How can uptime be improved?
Improving uptime involves proactive measures such as implementing redundant hardware, robust monitoring, and efficient maintenance procedures.
By understanding the various methods for checking system uptime and incorporating these practices into a comprehensive monitoring strategy, administrators can ensure optimal performance, stability, and reliability of their Linux servers.

