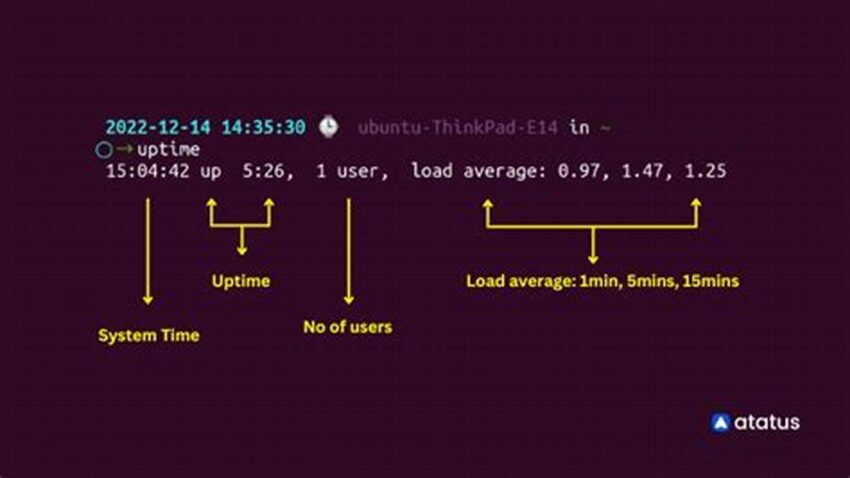
Determining a Linux server’s uptime is crucial for system administrators. It provides valuable insights into system stability, performance, and maintenance schedules. Understanding how long a server has been running can help diagnose performance issues, schedule necessary updates and reboots, and track the effectiveness of system administration practices. This information is essential for maintaining a healthy and reliable server environment.
Accessing Uptime Information
Several commands provide access to server uptime data.
The `uptime` Command
The simplest method is using the `uptime` command. This displays the current time, how long the system has been running, the number of users currently logged in, and the system load averages.
The `w` Command
The `w` command provides similar information to `uptime` but also includes details about currently logged-in users and their activities.
The `/proc/uptime` File
This file contains two values: the total number of seconds the system has been up and the total number of seconds the CPU has been idle.
`last` Command
The `last` command can show recent logins and system reboots, indirectly revealing uptime information by showing the last shutdown time.
`who` Command
The `who` command lists currently logged-in users and their login times, which can be helpful in conjunction with other commands for estimating uptime.
Systemd’s `systemd-analyze`
For systems using systemd, `systemd-analyze` provides detailed information about boot times, including the time spent on each service, which can be used to optimize boot performance and indirectly infer uptime.
Interpreting the Output
Understanding the output of these commands is crucial for accurate analysis. Pay attention to units (seconds, minutes, days) and load averages to gain a comprehensive view of system performance.
Using Uptime Data for System Administration
Uptime data informs decisions regarding maintenance, updates, and troubleshooting. Long uptimes might indicate a stable system but could also necessitate scheduled reboots for applying critical updates.
Security Considerations
While not directly related to finding uptime, extended uptimes can sometimes increase security vulnerabilities. Regularly patching and updating the system is essential regardless of uptime.
Tips for Effectively Utilizing Uptime Information
Regular Monitoring: Integrate uptime checks into regular monitoring routines to proactively identify potential issues.
Trend Analysis: Track uptime over time to identify patterns and potential problems. Decreasing uptime might indicate underlying hardware or software issues.
Correlation with Performance Metrics: Combine uptime data with other performance metrics like CPU usage, memory consumption, and disk I/O to get a holistic view of system health.
Documentation: Maintain records of system reboots and their reasons to facilitate future troubleshooting and analysis.
How can I find the exact boot time of my Linux server?
Use the `last reboot` command or check system logs (e.g., `/var/log/syslog` or `/var/log/messages`) for the most recent boot entry.
What does a high load average indicate?
High load averages suggest the system is struggling to keep up with demand. This could be due to high CPU usage, memory constraints, or disk I/O bottlenecks.
Is there a way to automatically monitor server uptime?
Yes, various monitoring tools and scripts can be configured to track uptime and alert administrators if a server becomes unavailable.
Why is my server’s uptime showing as very short even though I haven’t rebooted it recently?
This could be due to a system crash or unexpected restart. Check system logs for error messages or other indicators of a problem.
By understanding the various methods for checking server uptime and how to interpret the resulting information, administrators can effectively monitor system stability, schedule maintenance, and ensure optimal performance.

