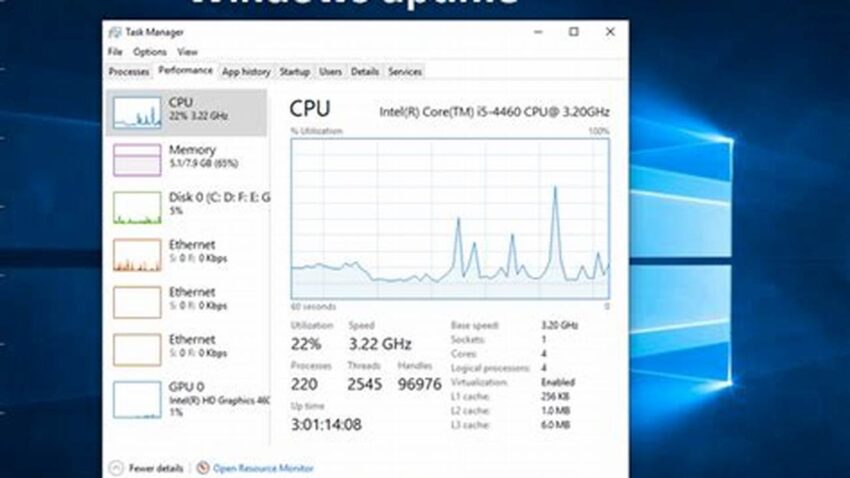
Knowing how long your Linux system has been running is often crucial for system administrators, developers, and even general users. This information can be vital for troubleshooting, performance analysis, and security audits. A system’s uptime can indicate potential issues, such as unexpected reboots or instability, and can help determine the effectiveness of system updates or configurations. Several straightforward methods allow quick access to this valuable data.
The `uptime` Command
The most direct method is the `uptime` command. It provides a concise overview of the current time, how long the system has been running, the number of users currently logged in, and the system load averages.
The `w` Command
The `w` command offers similar uptime information, alongside details about currently logged-in users and their activities.
The `/proc/uptime` File
This file contains two values: the total number of seconds the system has been up and the number of seconds the CPU has been idle. This raw data can be easily parsed by scripts for automated monitoring.
Systemd’s `systemd-analyze`
On systems using systemd, the `systemd-analyze` command provides comprehensive boot time statistics, including the overall time taken and the time spent by individual services.
The `last` Command
The `last` command displays a history of logins and reboots, indirectly revealing periods of uptime.
The `who` Command
Similar to `w`, the `who` command shows information about currently logged-in users, including their login time, which can be used to estimate uptime.
Graphical Tools
Many desktop environments offer graphical utilities within system monitors or settings panels that display system uptime.
Custom Scripts
For specific needs, custom scripts can be written to extract and format uptime data, integrating it into monitoring dashboards or reports.
Log Files
System logs often contain timestamps of boot events, which can be used to calculate uptime retrospectively.
Tips for Utilizing Uptime Information
Regularly checking uptime can help establish a baseline for normal system behavior.
Unexpectedly short uptimes warrant investigation into potential issues.
Long uptimes, while not necessarily problematic, can sometimes indicate a need for planned maintenance or updates.
Combining uptime data with other system metrics provides a more comprehensive understanding of system performance.
How can I use the /proc/uptime file in a script?
Read the file contents, split the string by spaces, and then convert the first element (representing seconds) to a more human-readable format.
What does a high load average alongside a long uptime suggest?
This could indicate a consistently high demand on system resources and might necessitate performance optimization or resource upgrades.
Is a long uptime necessarily a good thing?
While it can suggest stability, excessively long uptimes can sometimes defer necessary updates or patches, potentially increasing security risks.
Why is it important to check uptime after system updates?
This helps confirm that the system rebooted successfully after applying updates and is running stably.
How can uptime data be used in security audits?
Unexpected reboots or short uptimes could indicate unauthorized access or malicious activity.
What is the difference between the `w` and `who` commands?
While both display information about logged-in users, `w` provides additional information like system uptime and load average, whereas `who` focuses solely on user login details.
Understanding and utilizing the various methods to check Linux system uptime empowers users to monitor system health, diagnose problems, and ensure optimal performance.

